Plicker Questions from Class
2016-09-21
- How do you make each of the bars pink and outline each of the bars in black on a bar plot for the departing flights data based on carrier?
ggplot(data = flights, mapping = aes(x = carrier)) + geom_bar(color = "black", fill = "pink")ggplot(data = flights, mapping = aes(x = carrier)) + geom_bar(color = black, fill = pink)ggplot(data = flights, mapping = aes(x = carrier, color = black, fill = pink)) + geom_bar()ggplot(data = flights, mapping = aes(x = carrier, color = "black", fill = "pink")) + geom_bar()
- What is the biggest issue with stacked barplots?
- They can only show more than two categorical variables
- The amount of code needed to produce them is large
- It’s difficult to compare across the levels
- They can only show continuous variables
2016-09-19
-
What does the following code do when run in R?
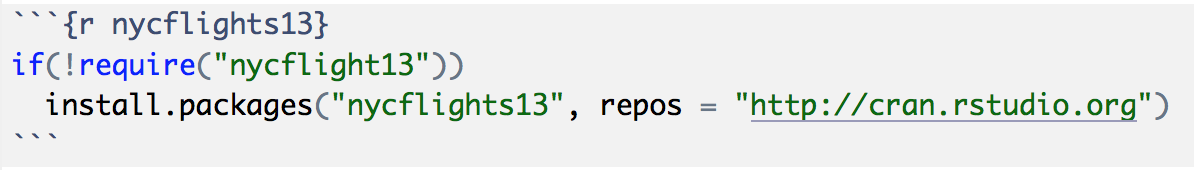
- Loads the
nycflights13package - Opens all datasets in
nycflights13 - Always downloads and installs the
nycflights13package - None of the above
- Loads the
-
Is this data set from the Pew Research Center in tidy data format?
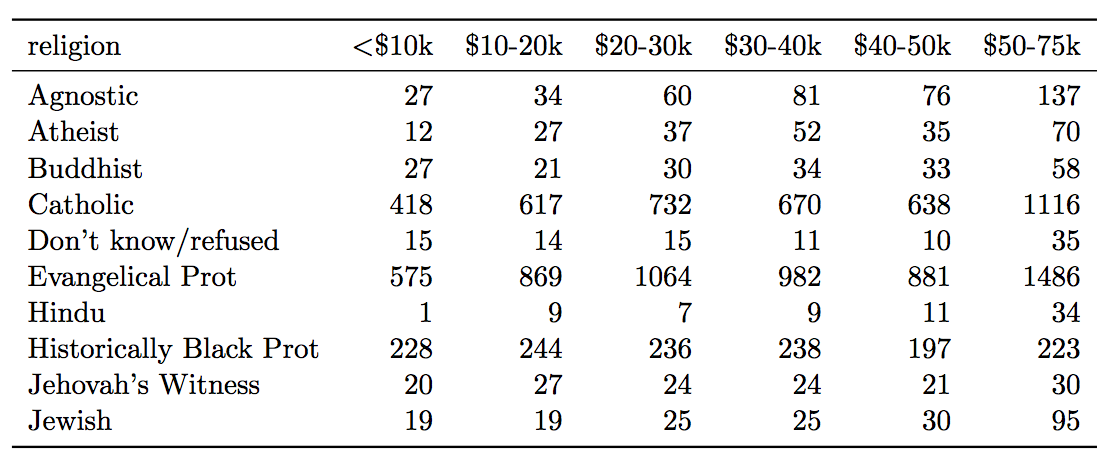
- Yes
- No
- Which of the following is not included in the Five Named Graphs (5NG) we will cover in this chapter?
- Pie-graphs
- Barplots
- Histograms
- None of the above
-
The following R code produces (assuming we have loaded the nycflights13 and ggplot2 packages) a histogram of departure delays for NYC flights.
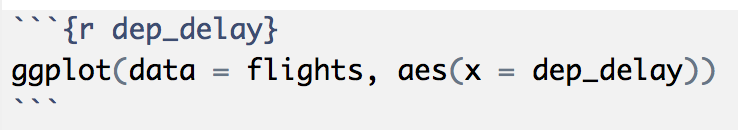
- True
- False
-
What is the purpose of faceting with ggplot2 plots?
- To zoom in on a plot to focus on a feature
- To change the color of the plot
- To create multiples of the same plot across levels of another variable
- None of the above
-
Fill in the blank with the appropriate term:
__________ provide a way to compare and contrast the distribution of ONE quantitative variable across multiple levels of ONE categorical variable.
- Barplots
- Histograms
- Boxplots
- Scatterplots
2016-09-14
- What is the appropriate definition of “observational unit”?
- The factor described in the data that is being analyzed and measured.
- The variable of the row that is being measured in the data set.
- The unit within a row that is being observed via the columns.
- The result of rows and columns creating a table.
- Which of the following is a characteristic of a tidy data frame?
- Variables correspond to rows.
- Columns may correspond to multiple variables.
- Values are what is stored on the inside of the data frame.
- Observational units are stored in the columns.
- What is the value of normal data forms?
- It allows you to easily merge two data sets by one or more variables in common.
- It reduces redundancy by not repeating values over and over again.
- Both of the above are true.
- None of the above.
2016-09-07
The U.S. government authorizes private contractors to audit bills paid by Medicare and Medicaid. The contractor audits a random sample of paid claims and judges each claim to be either fully justified or an overpayment. 30 small claims and 30 medium claims were chosen. We want to answer the question, “Does the chance that a claim is judged to be an overpayment depend on the size of the claim?”
- What is the explanatory variable?
- How a claim was judged (overpayment or fully justified).
- The size of a claim (small or medium).
- The proportion of claims that were judged to be overpayments.
- Whether or not a higher proportion of medium claims are judged as overpayments.
- What is the response variable?
- How a claim was judged (overpayment or fully justified).
- The mean number of overpayment claims.
- The proportion of claims that were judged to be overpayments.
- Whether or not a higher proportion of medium claims are judged as overpayments.
- Think about the proportion of students at your college who are wearing clothing that displays the college name or logo today. Also suppose that a friend of yours attends a different college, and the two of you have a recurring discussion about which college displays more school pride. You decide to measure school pride by the proportion of students at the college who wear clothing that displays the college name or logo on a particular day. You want to investigate whether this proportion differs between your college (call it Exemplary Students University, ESU) and your friend’s college (call it Mediocre Students University, MSU). What are the observational units?
- Clothing, with or without college logos.
- The two colleges.
- Students at both schools who wear clothing with college logos.
- Students at both colleges.