
Learning Quote of the Day
Take Notes!
Tidy Data

Is this tidy?
## # A tibble: 96 × 13
##       country `1952` `1957` `1962` `1967` `1972` `1977` `1982` `1987`
##         <chr>  <int>  <int>  <int>  <int>  <int>  <int>  <int>  <int>
## 1     Albania     -9     -9     -9     -9     -9     -9     -9     -9
## 2   Argentina     -9     -1     -1     -9     -9     -9     -8      8
## 3     Armenia     -9     -7     -7     -7     -7     -7     -7     -7
## 4   Australia     10     10     10     10     10     10     10     10
## 5     Austria     10     10     10     10     10     10     10     10
## 6  Azerbaijan     -9     -7     -7     -7     -7     -7     -7     -7
## 7     Belarus     -9     -7     -7     -7     -7     -7     -7     -7
## 8     Belgium     10     10     10     10     10     10     10     10
## 9      Bhutan    -10    -10    -10    -10    -10    -10    -10    -10
## 10    Bolivia     -4     -3     -3     -4     -7     -7      8      9
## # ... with 86 more rows, and 4 more variables: `1992` <int>, `1997` <int>,
## #   `2002` <int>, `2007` <int>
Beginning steps
Frequently the first thing you should do when given a dataset is to
- check that the data is tidy,
- identify the observational unit,
- specify the variables, and
- give the types of variables you are presented with.
This will help you with
- choosing the appropriate plot,
- summarizing the data, and
- understanding which inferences can be applied.
What is Tidy Data?
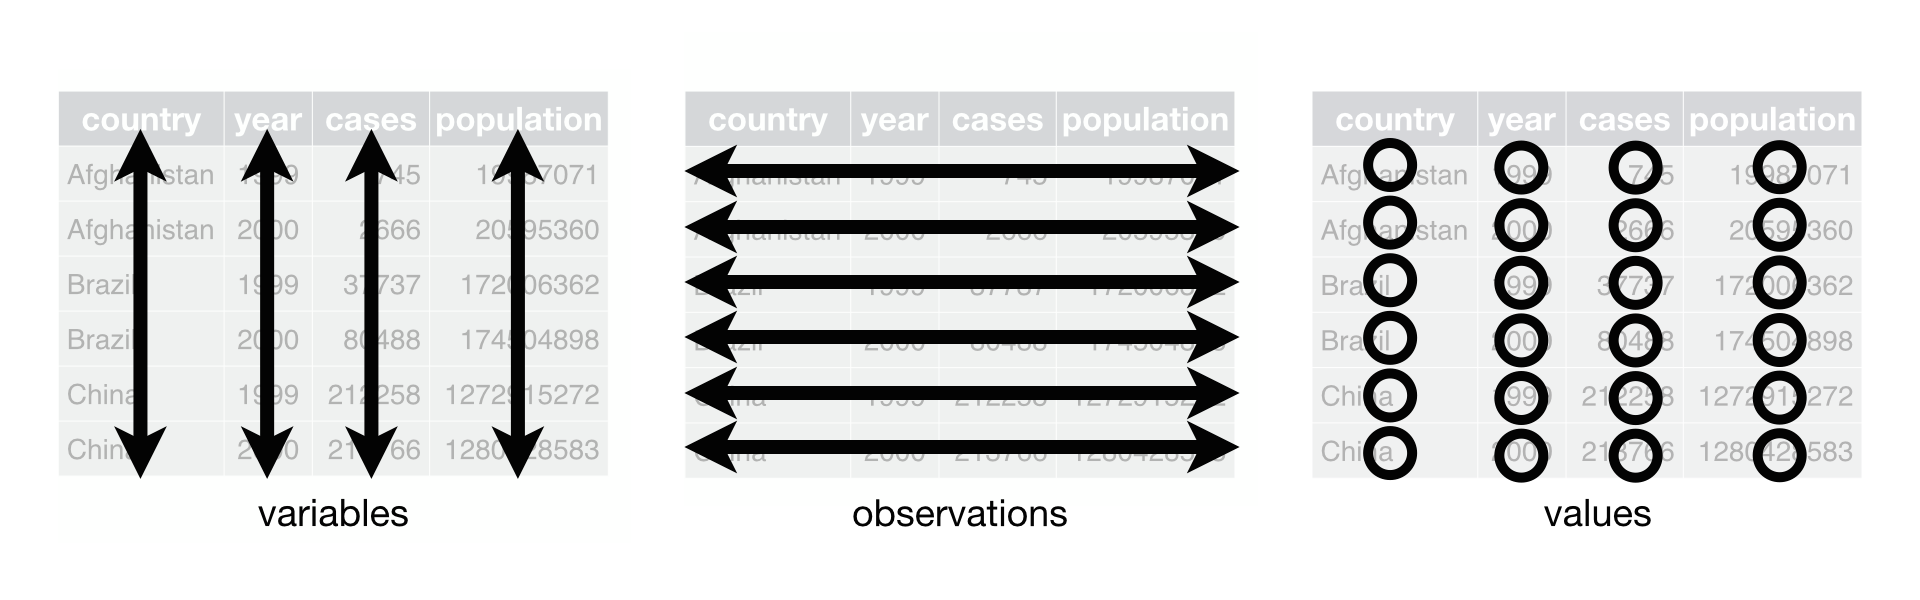
- Each variable forms a column.
- Each observation forms a row.
- Each type of observational unit forms a table.
The third point means we don't mix apples and oranges, keep apples together with apples.
What is Tidy Data?
- Each observation forms a row. In other words, each row corresponds to a single observational unit
- Each variable forms a column:
- Some of the variables may be used to identify the observational units. For organizational purposes, it's generally better to put these in the left-hand columns
- Some of the variables may be observed values associated with each observational unit
- Each type of observational unit forms a table.
What is Tidy Data?
This is just a spreadsheet!
But we are very strict about the previous three rules.
nycflights13 Package
Loaded via
library(nycflights13)Contains information about all flights that departed from NYC (e.g. EWR, JFK and LGA) in 2013: 336,776 flights in total.
To help understand what causes delays, it also includes a number of other useful datasets:
weather: hourly meterological data for each airportplanes: construction information about each planeairports: airport names and locationsairlines: translation between two letter carrier codes and names
All of these data frames are available for viewing here.
Work on Problem Set 2
Minute Paper
(Half sheet of paper is fine. Share with your neighbor.)
- What are the three characteristics of tidy data?
- Draw the DATA diagram that was presented on the board in all previous classes.